It’s easy to forget, when the calculators that are sold in big-box stores across the land, blister-packed in plastic, can perform the most ferociously complex calculations — and display the results in the form of a clear, easily-read graph — that there was a time when even a calculator that could manage more than the four basic arithmetic operations was considered a marvel of modern technology.
While today’s graphing calculators are capable of increasingly sophisticated algebraic processing, the earliest calculators were simple adding machines. Mechanical calculators have been around since 1820 and the Arithmometer, but machines that actually looked like modern calculators didn’t arrive until the middle of the 20th century. 1961 saw the arrival of ANITA (A New Inspiration To Arithmetic), but this was a vacuum-tube-powered monstrosity. The first real calculators — the first machines that might be recognizable as an ancestor to today’s modern graphing calculators — appeared in the 1970s, developed by the British company Sinclair Research and Busicom of Japan, but these were still four-function arithmetic machines. They also sported the green, glowing vacuum fluorescent displays that were typical of the machines of the day.
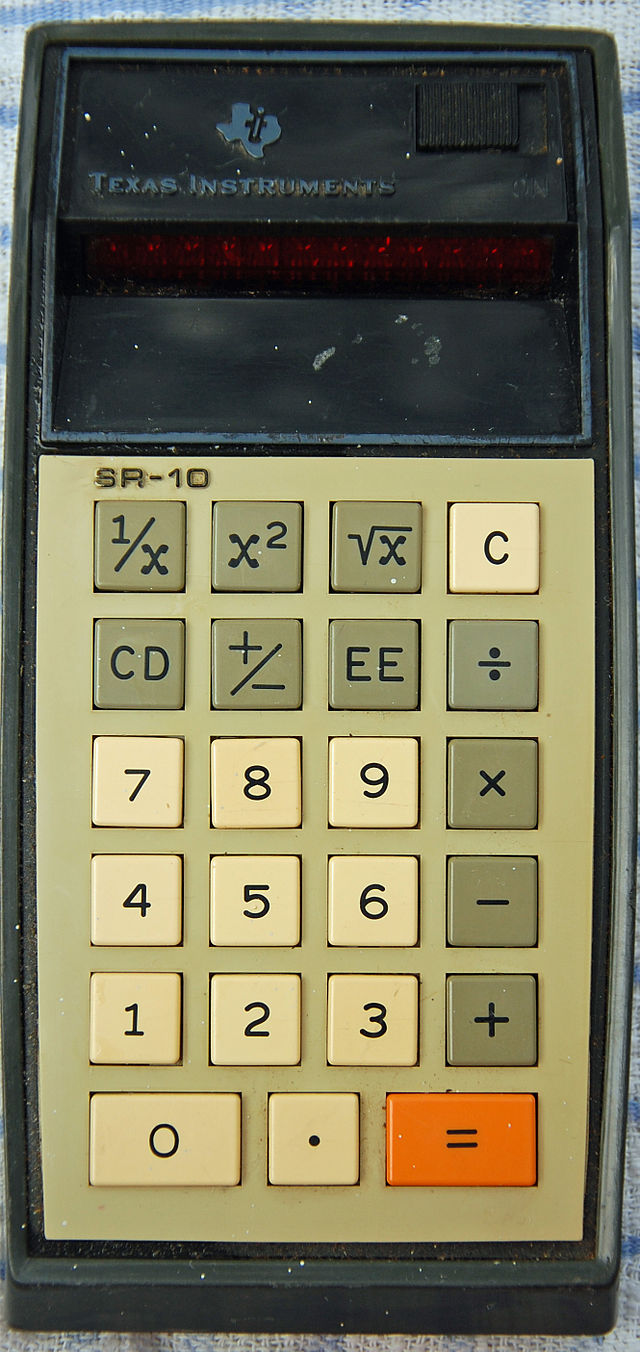
Texas Instruments made the next major leap, introducing the SR-10, a pocket calculator that used scientific notation and algebraic entry, and its successor, the TI-30 is still, albeit in highly modified form, still on sale today. But, for all its trigonometric clevernesses, its statistics functions and its dedicated p key — big news when the SR-11 first boasted one back in 1973 — the TI-30 still only displays numbers on its 10+2 display. It’s an LCD display, and it can show up to 12 digits in its answers, but alphanumerics are its only trick.
Over the next decade, calculator innovation was focused on the internal functions of the machine, but the big leap came in 1985, when Casio introduced the fx-7000G, the first commercially-viable graphing calculator. Graphic calculators represent a significant step ahead in two main areas. Firstly, they do more than simply process one calculation at a time — in order to plot a graph, the eventual output without which a graphing calculator would be, well, just a calculator, the device has to perform a whole series of calculations based on an equation or formula or function that the user has input, and then it must store the results of those calculations in its internal memory. This alone requires a considerable increase in processing ability, and also needs a calculator that can handle rather complex inputs, which in turn call for an increasingly powerful display.
Texas Instruments made the next major leap, introducing the SR-10, a pocket calculator that used scientific notation and algebraic entry, and its successor, the TI-30 is still, albeit in highly modified form, still on sale today. Early calculators, as we’ve seen, presented their answers via vacuum fluorescent displays. These were replaced, briefly, by light-emitting diodes, typically red-digit displays that had the same limitations on size — LEDs are clear and easy to read, but they are better suited to large-pixel displays. The very first liquid-crystal displays, now a mainstay of data-presentation devices from watches to phones to desktop-computer monitors, appeared as early as 1936, but the technology wasn’t truly ready for the kind of high-definition use a graphing calculator requires until the 1980s. Casio’s fx-7000G sported a 96×64 dot matrix, and each dot was either black or white, on or off — there was no grayscale or color in this display.
But what the fx-7000G could do was draw graphs. Thanks to its dot-matrix screen, it could plot, out of the box, algebraic graphs and statistical charts such as bar graphs, normal distribution curves and regression lines. It could also present graphs of user-input functions.
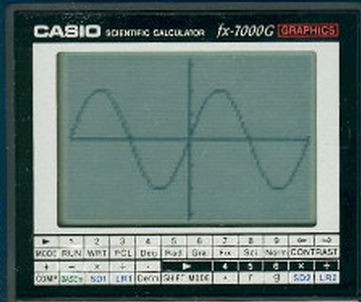
The other key difference between the fx-7000G and many of its predecessors was the fact that it could be programmed. In fact, graphing calculators started to blur the lines between calculators and computers, to the point that the fx-7000G shared much with the Casio BASIC handheld computer, including the ability to store programs in one of ten internal storage slots. The calculator was based on a custom processor designed by NEC of Japan and likely based on the Z80 processor that powered many early home computers, such as Sinclair Research’s famous ZX-80. It had 442 bytes — that’s bytes, not megabytes or even kilobytes — but clever programming saw users shoehorning useful routines like estimating indefinite integrals into minimal storage.

Not long after Casio opened up the market for graphing calculators, Hewlett Packard produced the HP-28 series, the first calculators that could solve equations symbolically. With the advent of computer algebra systems such as HP’s, graphing calculators increasingly resembled specialized computers; the ability to draw graphs became an integral part of the graphing calculator’s ability to present ever-more-complex outputs. And with 32 kilobytes — sixty times the storage Casio’s first graphic calculator offered — and a central processor running at 1MHz, the HP-28s, first sold in 1988, had specs that compared favorably with the desktop machines of only a year or two earlier.
HP replaced the HP-28 series with the HP-48, which again closed the gap between handheld and full-sized computing devices. With external data connections via RS232 serial port or a proprietary infrared protocol, the HP-48 also literally narrowed the distance between graphing calculators and desktop computers, providing a data path that enabled handheld devices to send data to a full-sized computer for more complex analysis and processing.
In the two decades that followed, the majority of innovation enjoyed by graphing calculators and their users was focused on processing power. While Texas Instruments’ TI-84, introduced in 2004, still used the same Z80 processor that informed the CPU powering Casio’s fx-7000G, the same processor that Zilog started selling in 1976, it now ran at a dizzying 15MHz. Users increasingly wanted to exploit the full processing power of their calculators, but the small screens and smaller buttons of a typical graphing calculator meant that writing programs on the desktop, compiling them and then transferring them to the calculator via a now-ubiquitous USB cable became the standard means of enhancing the device’s functionality.
Most graphing calculators have their own proprietary programming language, although these languages typically have at least a passing similarity with more established languages. Hewlett-Packard’s graphing calculators are programmed using RPL, which stands for, depending upon who you ask, either ROM-based Procedural Language or, both more accurately and a little more pleasingly, Reverse Polish LISP. Texas Instruments’ calculators prefer to be spoken to in TI-BASIC, but can also be programmed in Z80 assembly language, with C compilers also available.
While the insides of graphing calculators saw considerable progress during the 1990s and 2000s, externally little changed. When the TI-84 appeared in 2004, it boasted 128KB of internal RAM memory, and the ability to access external USB storage, but its interface with the world was still a 96×64-pixel monochrome display — no better than the fx-7000G, nearly twenty years earlier. The TI-84 Plus, in 2004, did, however, allow prettyprinted expressions, as did Casio’s 9860 series the following year. Mathematical expressions could now be displayed in a much more readable way — (x^3+2*y^4)/2 could be shown as 
Texas Instruments introduced the NSpire range in 2010, featuring a full-color 320×240 display that enables much more detailed displays of data. The addition of color is particularly noteworthy — more than one color means the ability to display more than one graph. (Mirtazapine) The NSpire range also interacts with Texas Instruments’ Lab Cradle, a development of the Calculator-Based Laboratory concept which was designed to enable a graphing calculator to become a full laboratory computer, able to collect, store and process data from a range of sensors.
With the development of software-only implementations of the graphing-calculator concept, is there still a role for dedicated graphing calculators? The graphing calculator as the hub of a data-gathering system is a niche that smartphone apps are as yet unable to fill — while a phone app is convenient, the phone is a generalist system that lacks the specialist functions that a graphing calculator can offer, such as sensor interfacing or the ability for users to program the calculator. And few schools and national testing organizations are willing to allow students to bring their smartphones into an examination room with them — indeed, increasingly graphing calculators are restricted too, with TI’s NSpire machines featuring a “Press-To-Test” mode which temporarily disables features such as 3D graphs for the duration of an exam.
But while dedicated hardware graphing calculators are increasingly specialized niche devices, math teachers and students are more and more turning to the Web for simple, but ever more powerful, graphing calculators. Meta-Calculator offers all the graphing features of a hand-held calculator, but takes full advantage of your computer’s monitor to display its graphs in full color, making its output clear and easy to read. Hand-held graphing calculators are great for students, but teachers find full-screen graphs invaluable for teaching, and the great advantage offered by web-based applications such as Meta-Calculator is its nimbleness — updating the firmware on a hardware calculator is a dance of downloads, cables and, occasionally, voodoo, but when Meta-Calculator’s developers added a “share” feature to the calculator, or tweaked the software to perfect its cube-root graphs, changes are made on a webserver in a process that’s transparent to the end user, who just sees better and better graphs.
Calculators have changed beyond recognition since the four functions and eight red digits of the pocket calculators of the 1960s and 1970s; today’s software-based graphing calculator apps and websites put what was expensive and highly specialized equipment in the hands of anyone who needs to generate graphs simply and easily.
We have various comprehensive calculators that you can use online for free. You can choose from t-test calculator, graphing, matrix, the standard deviation to statistics, and scientific calculators. Check it here.